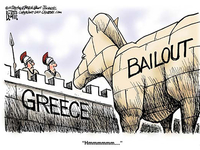


Winners and Losers in the Greek Financial Crisis
December 02, 2016
In early 2010, then Prime Minister George Papandreou concluded that the state of Greek public finances was so dire that the country could not hope to borrow on global markets, and thus could no longer service its public debt.
Contrary to prevailing notions, Greece’s problems did not stem from high-wage Greek workers, nor was it simply the result of a spendthrift state: Greek wages are only about 83 percent of prevailing levels across the EU15 (i.e. the countries that were members of the European Union prior to the expansion of 2004), while as a percentage of the national GDP, per capita public expenditures are just about average for the bloc. Rather, the Greek financial crisis stemmed from the strategy of the national ruling class and the way it integrated into the international division of labor, especially with Greece’s accession to the European Economic Community (EEC) in 1981 and the European Monetary Union in 2002. The inability of Greek capitalism to compete on the terms set by the single currency led to a collapse in GDP with a consequent increase in the debt-to-GDP ratio.
In any case, in early 2010, in the hope of meeting loan payments to the French and German banks that held most Greek bonds – and in order to avoid bankruptcy, which would have transferred Greece’s problem to the very heart of the European economy – it was decided that Greece would take out a loan from the European Union, the European Central Bank and the International Monetary Fund.
But before it could borrow the money, Greece would first have to adopt austerity measures. Between 2010 and 2016, three memoranda of economic cooperation were implemented, a medium-term program and eight packages of special measures – which included, among other measures, cuts in public employees’ salaries, cuts in pensions for the elderly, reduced minimum wage levels (from 751 euros to 586 for most Greek workers, and to 490 for those under 25 years), an increase in the VAT from 19% to 24%, extensive taxation of real estate, new flexible forms of employment, major cuts in public sector employment, regressive tax increases, and much more.
How effective were these policies? For a start, the public debt – the cause for which all these measures were adopted – has increased, in both absolute and relative terms. From €300 billion at the end of 2009, Greek debt rose to €314.4 billion by the end of 2015; indeed, because the Greek economy shrank in this period, national debt as a percentage of GDP skyrocketed from 126.7% to 179%. Meanwhile, unemployment rose from 9% in 2009 to 23.5% in May 2016, while GDP fell from €237.4 billion in 2009 to €179 billion in 2015.
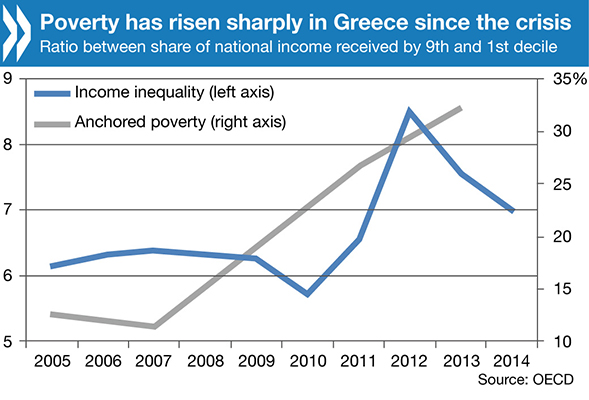
These statistics reveal the failure of all the measures taken. But a closer look reveals that the policy has produced winners and losers. On the losing side are the working classes (wage earners and small and medium-sized agricultural producers). It is worth noting, too, that only 15% of the unemployed today receive unemployment benefits; before the crisis, 40% of Greek unemployed were able to claim benefits. The percentage of those unable to meet their basic needs rose from 11% to 20%; today, more than one million Greeks live in households where nobody works, or where those with jobs work less than three months a year. 50% of pensioners receive a pension of less than €500 per month. From 2009 to 2015 the national poverty rate rose from 27.6% to 35.7%.
Even those who kept their jobs lost income. The share of wages in the GDP fell from 64% to 54%, and overall, wage earners have lost a third of their purchasing power. The average purchasing power fell from 84% of the average for the EU15 to 65%. Between 2008 and 2015, 427,000 Greeks emigrated, the great majority university-educated. Of the 849,289 businesses active in Greece in 2008, only 692,286 were still active in 2014. And inequality increased: the ratio between the income of the richest 20% and the poorest 20% went from 5.6/1 to 6.6/1.
The decline in living standards is also evident in Greek demographic data. Health expenditure fell by 25%. Between 2011 and 2014, the most recent year for which statistics are available, there were fewer births than deaths. Infant mortality rose by 51%.
But who are the winners? Among the biggest winners are the foreign banks, who at the outset of the crisis found themselves holding a large proportion of the Greek debt. In June 2010, the total public and private debt to foreign banks stood at $252.1 billion, with a total of 75.1% owed to French ($83.1 billion), German ($65.4 billion) and US ($36.2 billion) banks. By December 2010, the sum owed to foreign banks had been slashed by 42%, down to $145.7 billion ($56.7 billion to French banks, $34 billion to German banks, $7.3 billion to American banks). Under the first memorandum, the banks gained time to sell off a large portion of the Greek debt – a pattern that would become even more evident in December 2011, by which time the foreign banks had reduced their exposure to Greek debt to $35 billion. By the 2012 elections, foreign banks were almost entirely disencumbered of the Greek debt.
As for the winners inside Greece: In 2010, the country’s most profitable companies made profits on the order of €2.2 billion; by 2014 this had risen to €10.2 billion. The 300 companies with the largest sales (excluding the financial sector) between 2009 and 2014 increased their turnover from 53.6% of the total to 59.8% and their assets from 42.2% to 44.0%.
Last but not least: in 2011, 445 people in Greece held fortunes in excess of €30 million, amounting in total to €50 billion, about 24% of GDP. By 2014, that privileged group had grown slightly: 565 people held personal fortunes that amounted to a total of €70 billion or 39.5% of GDP for that year. In 2014, that elite group included eleven Greek billionaires, with total assets of €18 billion, up from nine in 2013 with assets of €16 billion.
These developments are reflected in the country’s patterns of social stratification. According to a recent survey today the Greek bourgeoisie accounts for 2.8% of GDP (down from 3.2% in 2009); the rich rural strata 0.6% (down from 0.7%); the traditional petty bourgeoisie 7.0% (down from 7.3%); the new petty bourgeoisie 21.9% (down from 29.5%); the medium rural strata 1.2% (down from 1.9%); the poor rural strata 7.3% (down from 7.4%); and the working class 59.2% (up from 49.1%).
Whatever the reasons for these policies, the result bears a clear social stamp. Large foreign banks, under the guardianship of international financial institutions and their home countries, took care of their own interests. Despite losses linked to the economic liquidation of some sectors, the country’s economic elite has enlarged its wealth, and increased its profit by virtue of the intensified exploitation of the local working class and the contraction of small to medium business.
Spyros Sakellaropoulos, Panteion University, Greece <sakellaropouloss@gmail.com>